lampe.plots
Plotting helpers.
Functions
Returns a dictionary of runtime configuration (rc) settings for nicer |
|
Displays each 1 or 2-d projection of multi-dimensional data, as a triangular matrix of histograms, known as corner plot. |
|
Marks a point on the histograms of a corner plot. |
|
Plots the expected coverage at various credible levels. |
Descriptions
- lampe.plots.nice_rc(latex=False)
Returns a dictionary of runtime configuration (rc) settings for nicer
matplotlibplots. The settings include 12pt font size, higher DPI, tight layout, transparent background, etc.- Parameters:
latex (bool) – Whether to use LaTeX typesetting or not.
Example
>>> plt.rcParams.update(nice_rc())
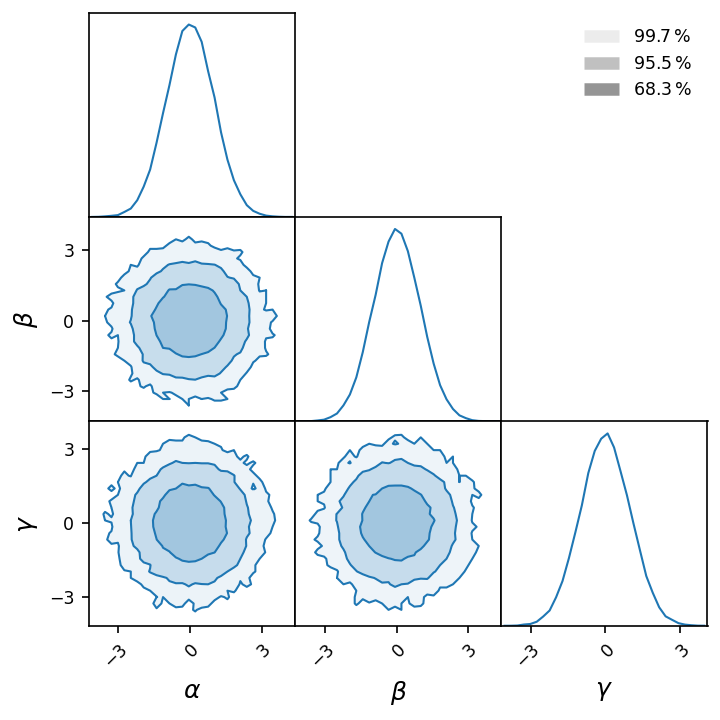
- lampe.plots.corner(data, weights=None, domain=None, bins=64, creds=(0.6827, 0.9545, 0.9973), color=None, alpha=(0.0, 0.5), legend=None, labels=None, smooth=0, figure=None, **kwargs)
Displays each 1 or 2-d projection of multi-dimensional data, as a triangular matrix of histograms, known as corner plot. For 2-d histograms, highest density credibility regions are delimited.
- Parameters:
data (ndarray) – Multi-dimensional data, either as a table or as a matrix of histograms.
weights (ndarray | None) – The importance weights of the data samples.
domain (Tuple[ndarray, ndarray] | None) – A pair of lower and upper domain bounds. If
None, inferred from data.bins (int | Sequence[int]) – The number(s) of bins per dimension.
creds (Sequence[float]) – The region credibilities (in \([0, 1]\)) to delimit.
color (str | tuple | None) – The color of histograms. If
None, use the color cycler instead.legend (str | None) – A legend.
smooth (float) – The standard deviation of the smoothing kernels.
figure (Figure | None) – A corner plot over which to draw the new one.
kwargs – Keyword arguments passed to
matplotlib.pyplot.subplots.
- Returns:
The figure instance for the corner plot.
- Return type:
Example
>>> data = np.random.randn(2**16, 3)
>>> labels = [r'$\alpha$', r'$\beta$', r'$\gamma$']
>>> figure = corner(data, bins=32, labels=labels, figsize=(4.8, 4.8))
- lampe.plots.mark_point(figure, point, color='black', linestyle='dashed', marker='s', legend=None)
Marks a point on the histograms of a corner plot.
- Parameters:
Example
>>> mark_point(figure, [0.5, 0.3, -0.7], color='black')

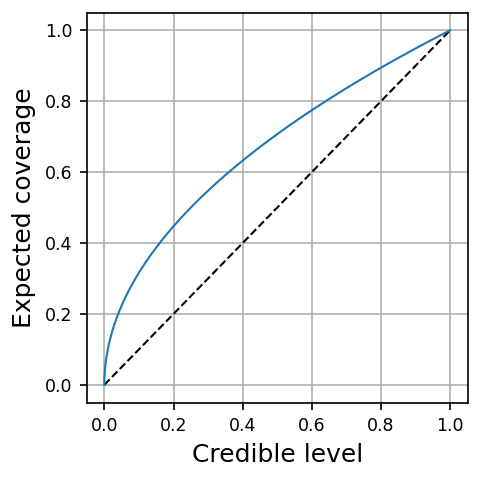
- lampe.plots.coverage_plot(levels, coverages, color=None, legend=None, figure=None, **kwargs)
Plots the expected coverage at various credible levels.
- Parameters:
levels (ndarray) – A vector of increasing credible levels.
coverages (ndarray) – A vector of corresponding expected coverages.
legend (str | None) – A legend.
figure (Figure | None) – Another coverage plot over which to draw the new one.
kwargs – Keyword arguments passed to
matplotlib.pyplot.subplots.
- Returns:
The figure instance for the coverage plot.
- Return type:
Example
>>> levels = np.linspace(0, 1, 512) ** 2
>>> coverages = np.linspace(0, 1, 512)
>>> figure = coverage_plot(levels, coverages)